What is the PE Ratio?
The P/E ratio shows how much investors pay for each dollar of a company’s earnings. It makes it easier to compare companies and decide where to invest.
The P/E ratio is like a price tag, showing whether a stock’s price reflects its value. Investors use it to compare stocks.
“Price is what you pay. Value is what you get.” -Warren Buffett
How to Calculate PE Ratio
To calculate the P/E ratio, divide the current share price by the earnings per share (EPS), as explained in Wikipedia and Investopedia:
P/E Ratio = Market Price per Share / Earnings per Share (EPS)
For example, if a stock costs $50 and its EPS is $5, the P/E ratio would be $50/$10 = 10.
This means investors are paying $10 for every $1 the company earns.
Types of PE Ratios
There are a couple of types of P/E ratios. Understanding their differences is key to fundamental analysis.
Trailing PE Ratio
The trailing PE ratio is based on the company’s earnings from the past 12 months and uses actual reported results.
Forward PE Ratio
The forward PE ratio is based on expected earnings for the next year. It shows what investors expect for growth, but it depends on predictions.
Is a High Price to Earnings Ratio Good or Bad?
A high P/E ratio is not automatically good or bad. It can mean investors expect growth or that current earnings are low. Sometimes, it can signal weak growth or problems in the business. Always look at growth, cash flow, and the quality of earnings.
Growth and Valuation
A high PE can mean a stock is expensive or that investors expect strong growth. A low PE might mean the stock is a bargain or that there are problems. Fast-growing companies frequently have higher PEs, whereas stable companies usually have lower ones.
Investment Decisions
A low PE might signal a good time to buy, while a high PE could suggest selling if growth is weak.
Always compare a company’s PE to the industry average. If it’s below average, the stock may be undervalued; if it’s above, it could be overpriced.
Setting up customizable stock alerts can help you react quickly when valuation metrics shift.
Application in Stock Valuation
So, how can you use PE ratios in stock valuation? The most important thing is to make sure you are comparing apples to apples.
The PE ratio for a bank is likely be very different from that of a software company.
For a deeper dive, explore comprehensive stock analysis methods to evaluate companies across multiple metrics.
Comparative Examination
Investors usually compare companies’ PE ratios within the same industry because they face similar business conditions. For example, if Company A has a PE of 15 and Company B has a PE of 20 in the same sector, Company A might be undervalued if both have similar growth and risk. Comparing companies from different industries can be misleading because each sector has its own factors that affect value.

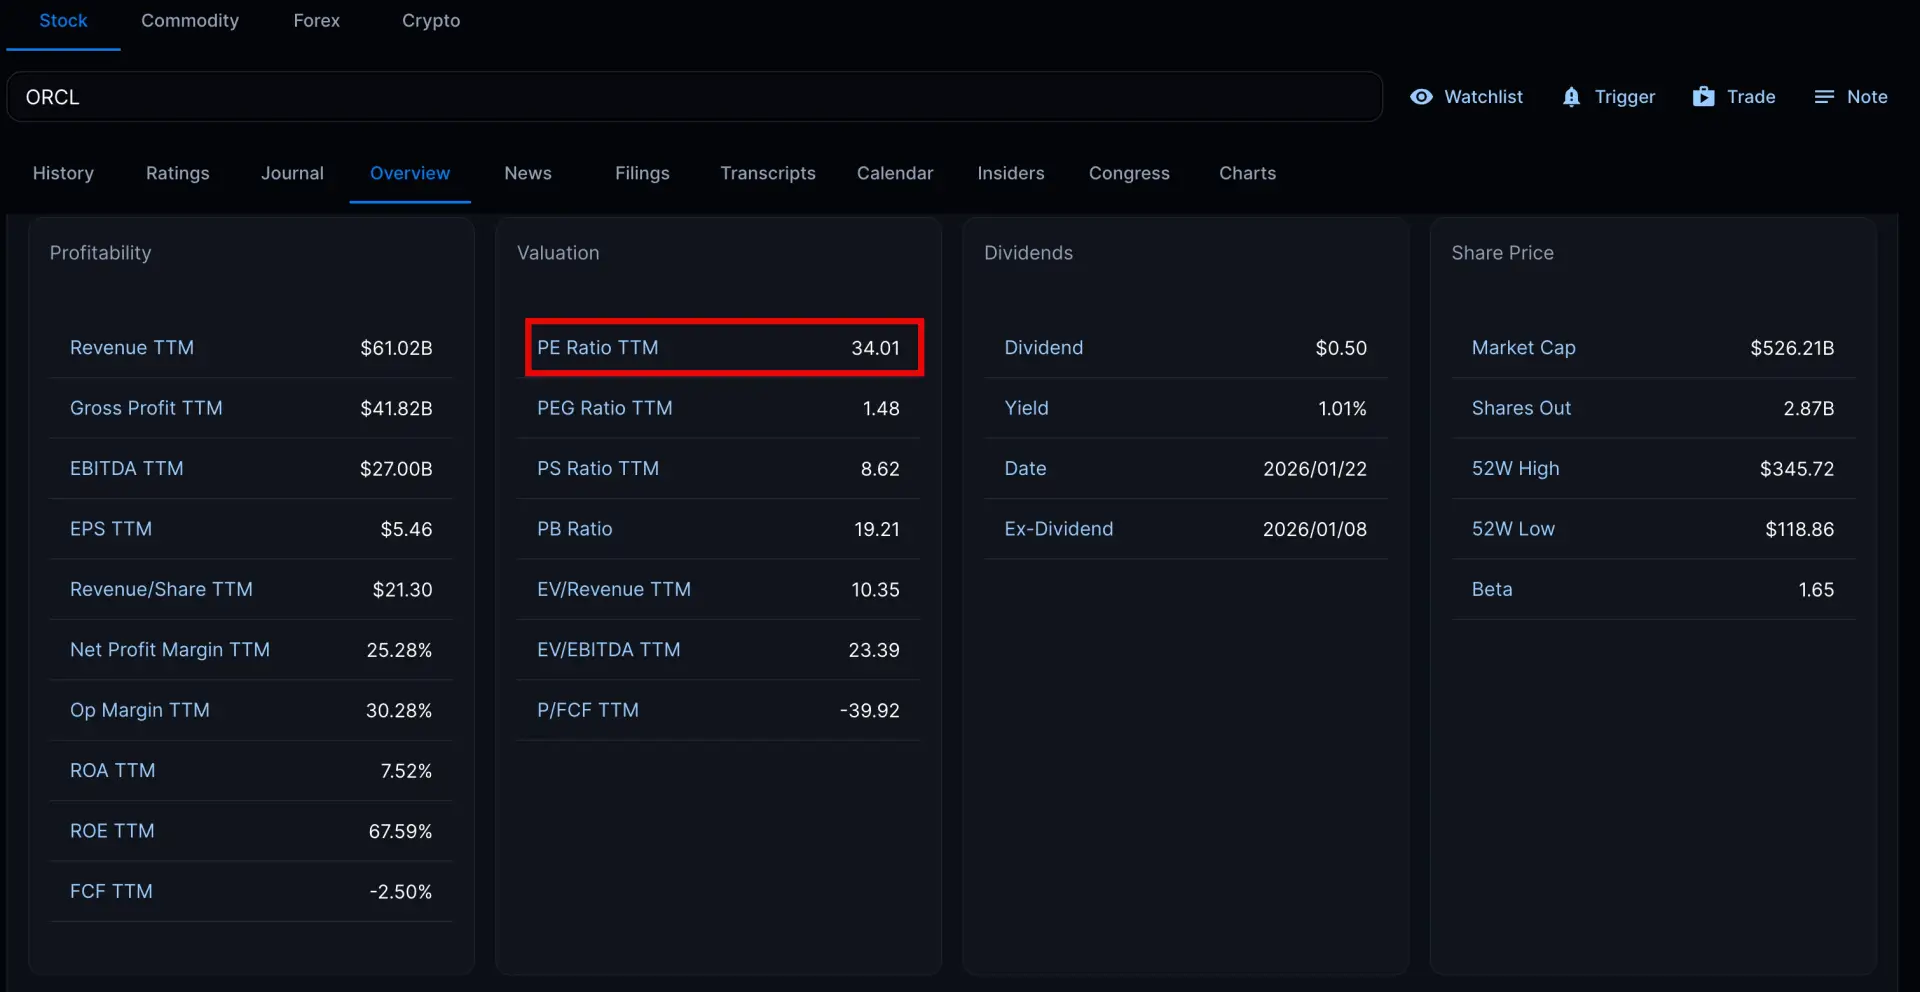
Let’s look at two companies in the Software–Infrastructure sector: Microsoft (MSFT) and Oracle (ORCL). As of 2026/01/26, Microsoft’s P/E ratio is 33.01, and Oracle’s is 34.01. Does this mean Microsoft is a better value because it has a lower PE? Not always. Just comparing P/E ratios does not tell the whole story. You also need to consider factors such as growth expectations, profitability trends, and each company’s revenue streams.
Price-to-Earnings Ratio Limitations
The P/E ratio is helpful, but it does have some limits:
- Earnings Manipulation: Companies can use accounting methods to alter earnings and affect the PE ratio.
- Growth Differences: The P/E ratio doesn’t show growth rates. A high PE may be justified by fast growth.
- Industry Differences: Average PEs vary by industry, so cross-sector comparisons can be misleading.
- Market Conditions: Economic trends and investor sentiment can affect P/E ratios, sometimes leading to mispriced stocks.
FAQ
What is P/E v.s. PEG Ratio?
The P/E ratio tells you what investors pay for current earnings. The PEG ratio also accounts for expected growth, helping you decide whether a stock’s price is fair given its future potential. Read Understanding the PEG Ratio in Stock Valuation for more insights.
What does a negative PE ratio mean?
A negative P/E ratio means the company lost money during the period measured. If EPS is negative, the P/E will also be negative, but this does not help value the stock. A negative P/E shows the company had losses. It does not tell you about the stock’s price or value.
Why is the AMD PE ratio so high?
As of 2026/01/26, AMD’s PE ratio is 123.51. This high P/E suggests investors expect AMD to grow, especially as its AI and data-center products expand following significant research spending and lower profits. When current earnings are low, but growth expectations are high, the P/E rises, signaling a favorable view of future profits.
Why is the Google PE ratio so low?
As of 2026/01/26, Alphabet’s (Google’s parent company) PE ratio is 32.47. While the PE for Alphabet may have been low in the past, the current PE is not considered low relative to historical market averages.
How reliable is Meta’s P/E ratio?
As of 2026/01/26, Meta’s PE ratio is 28.93. Meta’s P/E is somewhat reliable because the company has steady profits and good cash flow. However, it can be volatile, as it also reflects high spending in areas such as virtual reality and AI. There is some uncertainty about how these capital expenditures will affect profits moving forward. It’s best to use the P/E along with other measures for a complete picture.
The Bottom Line
The P/E ratio helps show how the market values a company’s earnings and lets investors compare growth and value. It’s most useful when used alongside other financial tools to make investment decisions.